Sensors
The library works with any sensor whose datasheet plots a resistance ratio against concentration. These are the sensors and gases with a fitted curve, from the Calibration coefficients page, and the examples that read each:
| Sensor | Gases with a fitted curve | Examples |
|---|---|---|
| MQ-2 | alcohol, CH4, CO, H2, LPG, propane | Calibration, ESP32/ESP32_WROOM_32D, MQ-2, MQ-Board |
| MQ-3 | alcohol, benzene, CH4, CO, hexane, LPG | Alcoholimeter, AlgorithmTester, ESP32, ESP8266, MQ-3, MQ-Board |
| MQ-4 | alcohol, CH4, CO, H2, LPG, smoke | LinearVsExponential, MQ-4, MQ-4-ALL, MQ-4-LINEAR, MQ-Board, smokeDetector |
| MQ-5 | alcohol, CH4, CO, H2, LPG | MQ-5, MQ-Board |
| MQ-6 | alcohol, CH4, CO, H2, LPG | MQ-6, MQ-Board |
| MQ-7 | alcohol, CH4, CO, H2, LPG | MQ-7, MQ-Board |
| MQ-8 | alcohol, CH4, CO, H2, LPG | MQ-8, MQ-Board |
| MQ-9 | CH4, CO, LPG | MQ-9, MQ-9-ALL, MQ-Board |
| MQ-9B | CH4, CO | none yet |
| MQ-131 | Cl2, NOx, O3 | MQ-131 |
| MQ-135 | acetone, alcohol, CO, CO2, NH4, toluene | MQ-135, MQ-135-ALL, MQ-135-CorrectionFactorDHT11, MQ135-ADS1115 |
| MQ-136 | CO, H2S, NH4 | MQ-136 |
| MQ-137 | C2H6O, CO, NH3 | none yet |
| MQ-303A | ethanol, H2, iso-butane | MQ-303A |
| MQ-309A | alcohol, CH4, CO, H2 | MQ-309A |
The coefficients page gives each curve's a and b, the concentration range it was fitted over, and how far the fit strays from the datasheet's points. Some curves are flat or noisy on their figure and fit poorly; check the Largest error column before relying on one.
MQ-3: mg/L, not ppm
The MQ-3 datasheet plots alcohol in mg/L, so its curves return mg/L. The value from readPpm() is in mg/L, and printDebug() still labels it ppm.
MQ-131: R0/Rs
The MQ-131 datasheet plots R0/Rs rather than Rs/R0, so its curves need
MQ131.setRatio(MQRatio::R0OverRs);
calibrate still takes the clean-air ratio as Rs/R0. The figure reads R0/Rs = 12.0 in clean air, so MQ-131 calibrates with 1.0 / 12.0.
MQ-303A: supply offset
The MQ-303A examples compute Rs from the supply less 0.45 V:
MQ303.setSupplyOffset(0.45);
The offset applies wherever Rs is computed, including during calibration.
MQ-7 and MQ-309A: heater cycle
These two sensors are read while their heater alternates between a high and a low voltage, rather than at a constant 5 V. The examples switch the heater with a logic-level MOSFET on a PWM pin:
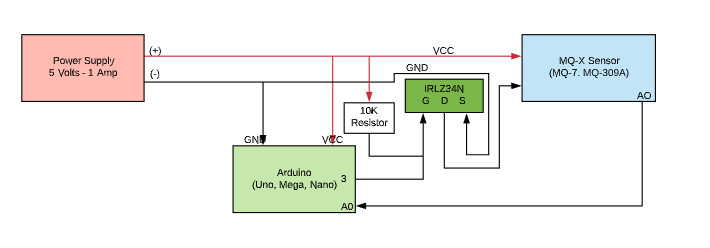
MQ-7 runs 60 s at 5 V then 90 s at about 1.4 V; MQ-309A runs 30 s high then 120 s low. Check the timing and voltages against your sensor's datasheet before relying on them, and read the concentration at the point of the cycle the datasheet specifies.
A sensor powered from two separate supplies works too; the library only reads the output.
ESP32 and ESP8266
The sensor runs from 5 V and its output can reach 5 V, above what a 3.3 V analog input accepts. Divide it down. With 1.7 kΩ over 3.3 kΩ, 5 V becomes 3.3 V:
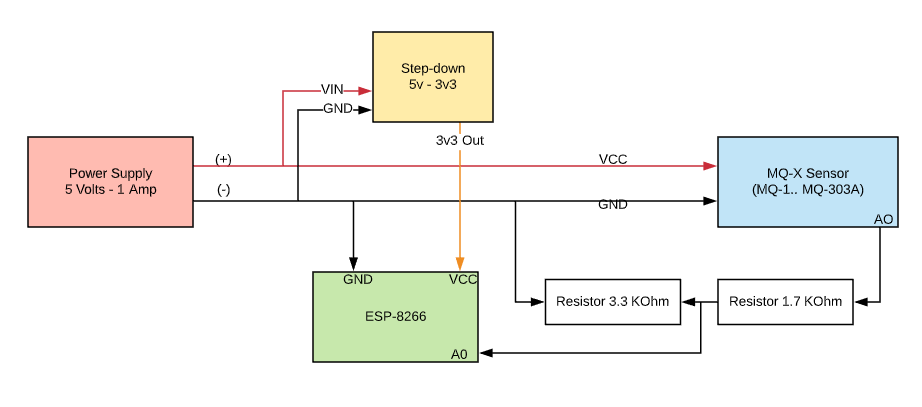
The divider scales the output and the supply by the same factor, so leave the supply at its default, the ADC reference (3.3 V), as the ESP examples do. See Set up the circuit.
On the ESP32, Wi-Fi takes over the second ADC (ADC2, GPIOs 0, 2, 4, 12 to 15 and 25 to 27), and analog reads on those pins fail while it is on. Use an ADC1 pin (GPIO 32 to 39) in a sketch that uses Wi-Fi; ESP32/ESP32_WROOM_32D reads GPIO 36 for that reason.
A sensor not listed
Any MQ-style sensor works the same way: find its sensitivity figure, read points off the curve for the gas you need, and fit a and b. Curve tracing does this reproducibly for a datasheet in the repository's manifest; Methods explains the steps. A curve from another source can be passed to setCurve directly.